vzi.
c. 2009–2023
A pipeline for seeing differently.
A few commands can sift through millions of records, isolate a signal, and reshape the result. Understanding what comes out may require a different kind of instrument. vzi brings the browser into that same workflow, turning a stream of data into a visual space that can evolve with the investigation.
The idea began with viz in 2009, a native Mac application that applied a programmable drawing function to each incoming record. Streams could become animated graphics, with playback and checkpoints for moving back through their history. The examples ranged from plotting data to generating abstract art. vzi carried that approach into the browser in 2017, opening it to the web’s drawing and interaction capabilities; a 2023 rewrite renewed the command-line implementation.
A world in three columns.
The map below begins with latitude, longitude, and language. Position and color are enough for the observations to trace the continents and reveal patterns within them. There is no basemap: the geography emerges from the data itself.
In a terminal, those same observations are rows of numbers and labels. Projected into space, their density, gaps, and relationships become visible together. A small transformation changes what can be understood, and what becomes interesting to ask next.
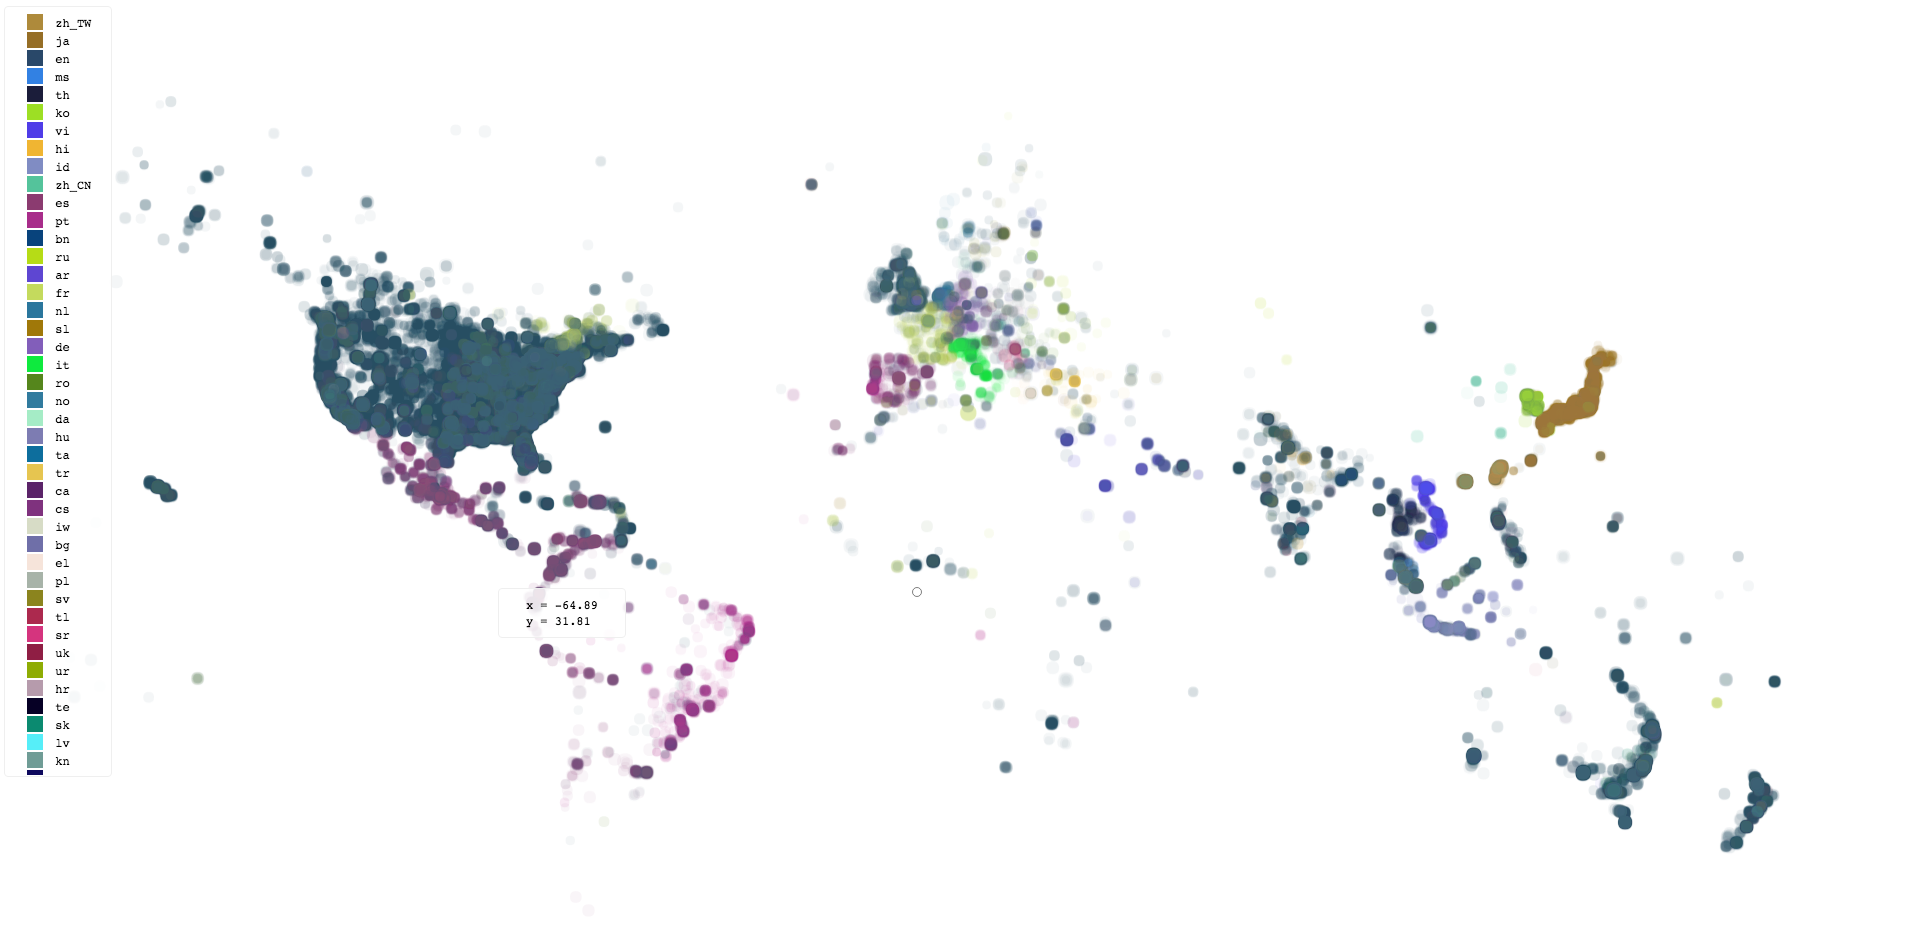
vzi -m scatter \
  -d 'y=lat($[0])' \
-d 'x=lng($[1])' -d c=2Follow the question.
The view takes shape as records arrive. Data preparation stays in the pipeline, where filters, calculations, and transformations can be composed freely. Browser-side expressions determine how fields become positions, colors, sizes, and labels. Change the selection or the projection, run the pipeline again, and a different aspect of the same data comes into view.
Scatter plots expose relationships between measurements. Histograms and grouped views bring distributions and concentrations into focus; tables allow closer inspection of individual records. The modules share machinery: a histogram is a particular arrangement of the more general bucket renderer. This makes the collection a vocabulary that can be extended and recombined as an analysis develops.
Build the instrument.
A custom renderer can use the browser as freely as any other web application. It establishes a document, receives successive events, and decides how each one changes the view. That small interface leaves room for diagrams, animation, specialized controls, and visual forms that do not fit an existing chart type.
The result is a working web page. It can serve as a temporary place to explore, or produce an HTML report through the renderer’s export behavior. Output returns to the command line, keeping the visual stage part of the larger composition. The same design accommodates a quick inspection and a purpose-built analytical tool.
That freedom is the enduring idea behind viz and vzi. An unusual dataset can call for an unusual way of seeing: watching a simulation unfold, examining the rhythm of a system, or letting a mathematical process draw its own form. Building the right instrument can become part of the discovery.